Source
Live Mint
http://www.livemint.com/Politics/7gyu4KOIrDS8OHEjS2EJZJ/Most-important-factor-for-voters-is-candidate-followed-by-p.html
Date
City
New Delhi

This survey, with 240,000 respondents, covered each and every parliamentary constituency, and respondents were asked to rate their MPs on over 20 parameters. Photo: Hindustan Times
Bangalore-based not-for-profit Daksh, in association with the Association for Democratic Reforms (ADR), recently conducted an India-wide survey to evaluate the performance of members of Parliament (MPs).
This survey, with 240,000 respondents, covered each and every parliamentary constituency, and respondents were asked to rate their MPs on over 20 parameters. Based on these responses, Daksh and ADR have come up with a consolidated score for each MP.
Election Metrics is not particularly concerned about these scores. Apart from getting information from the respondents on the performance of their MPs and what issues matter to them more, the survey also asks some other questions that make for interesting analysis. In this piece, we will look at some of the auxiliary but nevertheless interesting data that the survey found.
The survey asked if the respondent voted in the last parliamentary election, and if they didn’t, the reason for not voting. Given the massive sample size of the survey, and the fact that the survey gets out demographic data such as age, gender, caste, religion and socioeconomic status, it appears we can get valuable information on what drives voting percentages.
The data, however, disappoints. Going by the survey data, a whopping 86% of respondents said they voted in the last election. Considering that the actual turnout in the 2009 general election was around 60%, this can mean one of two things—either Daksh’s sampling is biased heavily in favour of people who voted in the last election, or the responses were biased—people don’t like admitting that they didn’t vote, and so would’ve said they voted even if they didn’t. Either way, the rest of the analysis (and perhaps the survey itself) needs to be taken with some salt.
What is interesting is that the voting percentage, as disclosed by the survey, doesn’t vary across different cuts of the data. For example, it varies between 84% and 87%, going by the respondent’s religion. Going by caste, it varies between 86% and 88%. Only 45% of about 10,000 students surveyed and only 67% of over 60,000 respondents under 30 voted in the last election. This, of course, includes people who are currently aged below 23, who were not eligible to vote in the last election. Eliminating voters below 23, the declared voting percentages for these two groups again return to close to normal.
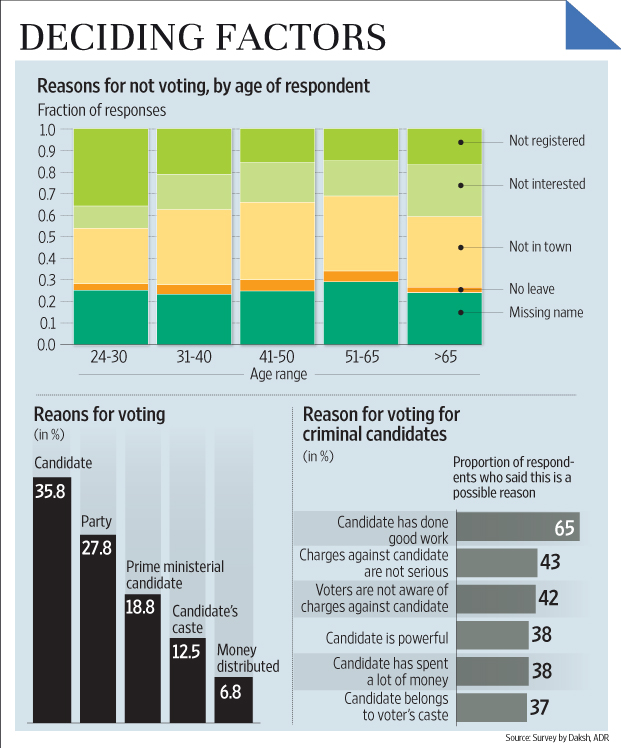
The survey asks people who said they did not vote in the last election for the reason they did not vote. About one-fourth of respondents across age groups mentioned that it was because they did not find their names in the voting lists. About one-third of young (aged below 30) respondents mentioned that they did not vote because they were not registered to vote. Interestingly, the percentage of people who mentioned they were not interested in voting grows with age.
Another interesting question was whether the respondent voted for the winning candidate. A whopping 75% of respondents declared that they had indeed voted for the winning candidate. Considering that in the 2009 general election, the winning candidate got an average of 44% of the votes in the constituency, it doesn’t tally. Once again it shows up a bias in surveys, which is that people want to be seen as having supported the winner.
The survey asked respondents about the reason they vote for a particular candidate. They were given five choices—candidate, party, party’s prime ministerial candidate, caste and money distribution. Respondents had to rank each of these as either very important, important or not important. Based on the responses, we quantified them by normalizing responses (for example, if the voter says very important for all five factors, each is given a value of 0.2. very important factors are given a weight of 2, important 1 and not important a weight of 0 in our calculation). Taking the average across respondents for each of these factors, we can gauge the aggregate importance of each of the five factors across all voters.
It is interesting that, according to the survey, the most important factor for voters is the candidate, followed by party. It must be mentioned, however, that the design of the survey was not very good in getting this information—when asked to classify a set of factors in terms of important, very important and not important, it can confuse the respondent and the variability in their responses is unlikely to be high. A better method to gauge the importance of various factors might have been to either use a larger Likert scale (with possibly five choices instead of three), or to have asked the respondents to rank in order the various factors.
It can also be seen from the accompanying table that morality is at play here—the politically incorrect choices—distribution of money and caste, are at the bottom of the table, while conventional political wisdom suggests they are more important.
Lastly, there was a question in the survey on why people vote for criminal candidates. The voters were given six choices. The following table shows what proportion of respondents said yes for each of the six possibilities. Note that a respondent could have said yes for more than one possibility.


